OCR Benchmarking Methodology for Production Document Types
Standard benchmarks miss the production chaos that destroys real OCR pipelines.

A team picks the top model on a leaderboard, runs its first real batch of invoices through it, and watches the extraction fall apart on documents the benchmark never showed it. Standard OCR benchmarks score text fidelity on clean, predictable inputs instead of the messy variability that defines real pipelines. That mismatch is what any serious OCR evaluation has to solve first.
Why standard OCR benchmarks fail on production documents
Benchmarks were built to test a narrow slice of what documents actually look like: curated test sets, consistent single-column layouts, born-digital PDFs, with scoring done per page or per field in isolation. Those conditions make for clean experiments, but they bear little resemblance to what arrives in a production queue. Production pipelines process multi-page mortgage packages running past 200 pages that require resolving the same entity across dozens of pages, alongside scanned PDFs degraded by skew, low DPI, fax compression artifacts, and quality that shifts from page to page within a single file.
Five structural mismatches account for most of the gap between what benchmarks measure and what production demands. Layout variability is the first: benchmark documents are built around a single, stable layout, while a single vendor's invoices can arrive in dozens of different formats over the course of a 12-month relationship. Noise and degradation is the second: because benchmarks are built from born-digital PDFs, they never surface the failure modes that come from fax compression or low-DPI scans, since those artifacts don't exist in the test set to begin with. Multi-page context is the third, since scoring a document page by page structurally prevents any measurement of whether a system can carry an entity or a reference across page breaks. Domain formatting is the fourth: financial statements, logistics manifests, and healthcare records each carry vertical-specific conventions that generic datasets simply don't include. Handwriting and mixed content round out the list, since benchmarks tend to measure clean typed regions while production forms routinely mix stamps, handwritten fields, and signature blocks on the same page.
None of this means the models are weak. It means the test conditions were never built to expose the failure modes production actually produces.
What CER and F1 measure
Character error rate and F1 score each conceal a different, specific failure mode, and neither one captures the layout dimension that determines field identity in a structured document. CER calculates the proportion of incorrectly recognized characters against a ground truth transcription, and that calculation treats every character as interchangeable. A low CER sounds reassuring right up until the error lands on a policy number, a dollar amount, or a medication dosage. The error rate itself is uniform in how it's calculated, but the real-world damage from that error is concentrated wherever the field happens to be high-stakes. CER scores a misread character in a boilerplate address line the same as a misread character in a total-due field, because distinguishing between them was never part of what the metric does.
F1 carries its own blind spot. It balances precision and recall across extracted tokens, so a system that recovers most fields correctly but consistently misses low-frequency fields still posts a strong F1 score, even though those low-frequency fields are often the exact ones a workflow depends on most.
Neither metric touches layout. A model can post a 98% CER on a curated test set while completely misreading the table structure it contains, treating merged cells as independent rows or collapsing a multi-column layout into one undifferentiated text stream. Downstream extraction then receives characters that were transcribed correctly but assigned to the wrong field entirely, producing output that looks confident and reads cleanly while attaching the right numbers to the wrong fields. Whether a system read the text correctly and whether it understood where that text lives on the page are two structurally distinct questions, and collapsing both into a single composite score makes both failures invisible at once.
Benchmark leaderboards that rank a model first while it fails in head-to-head use
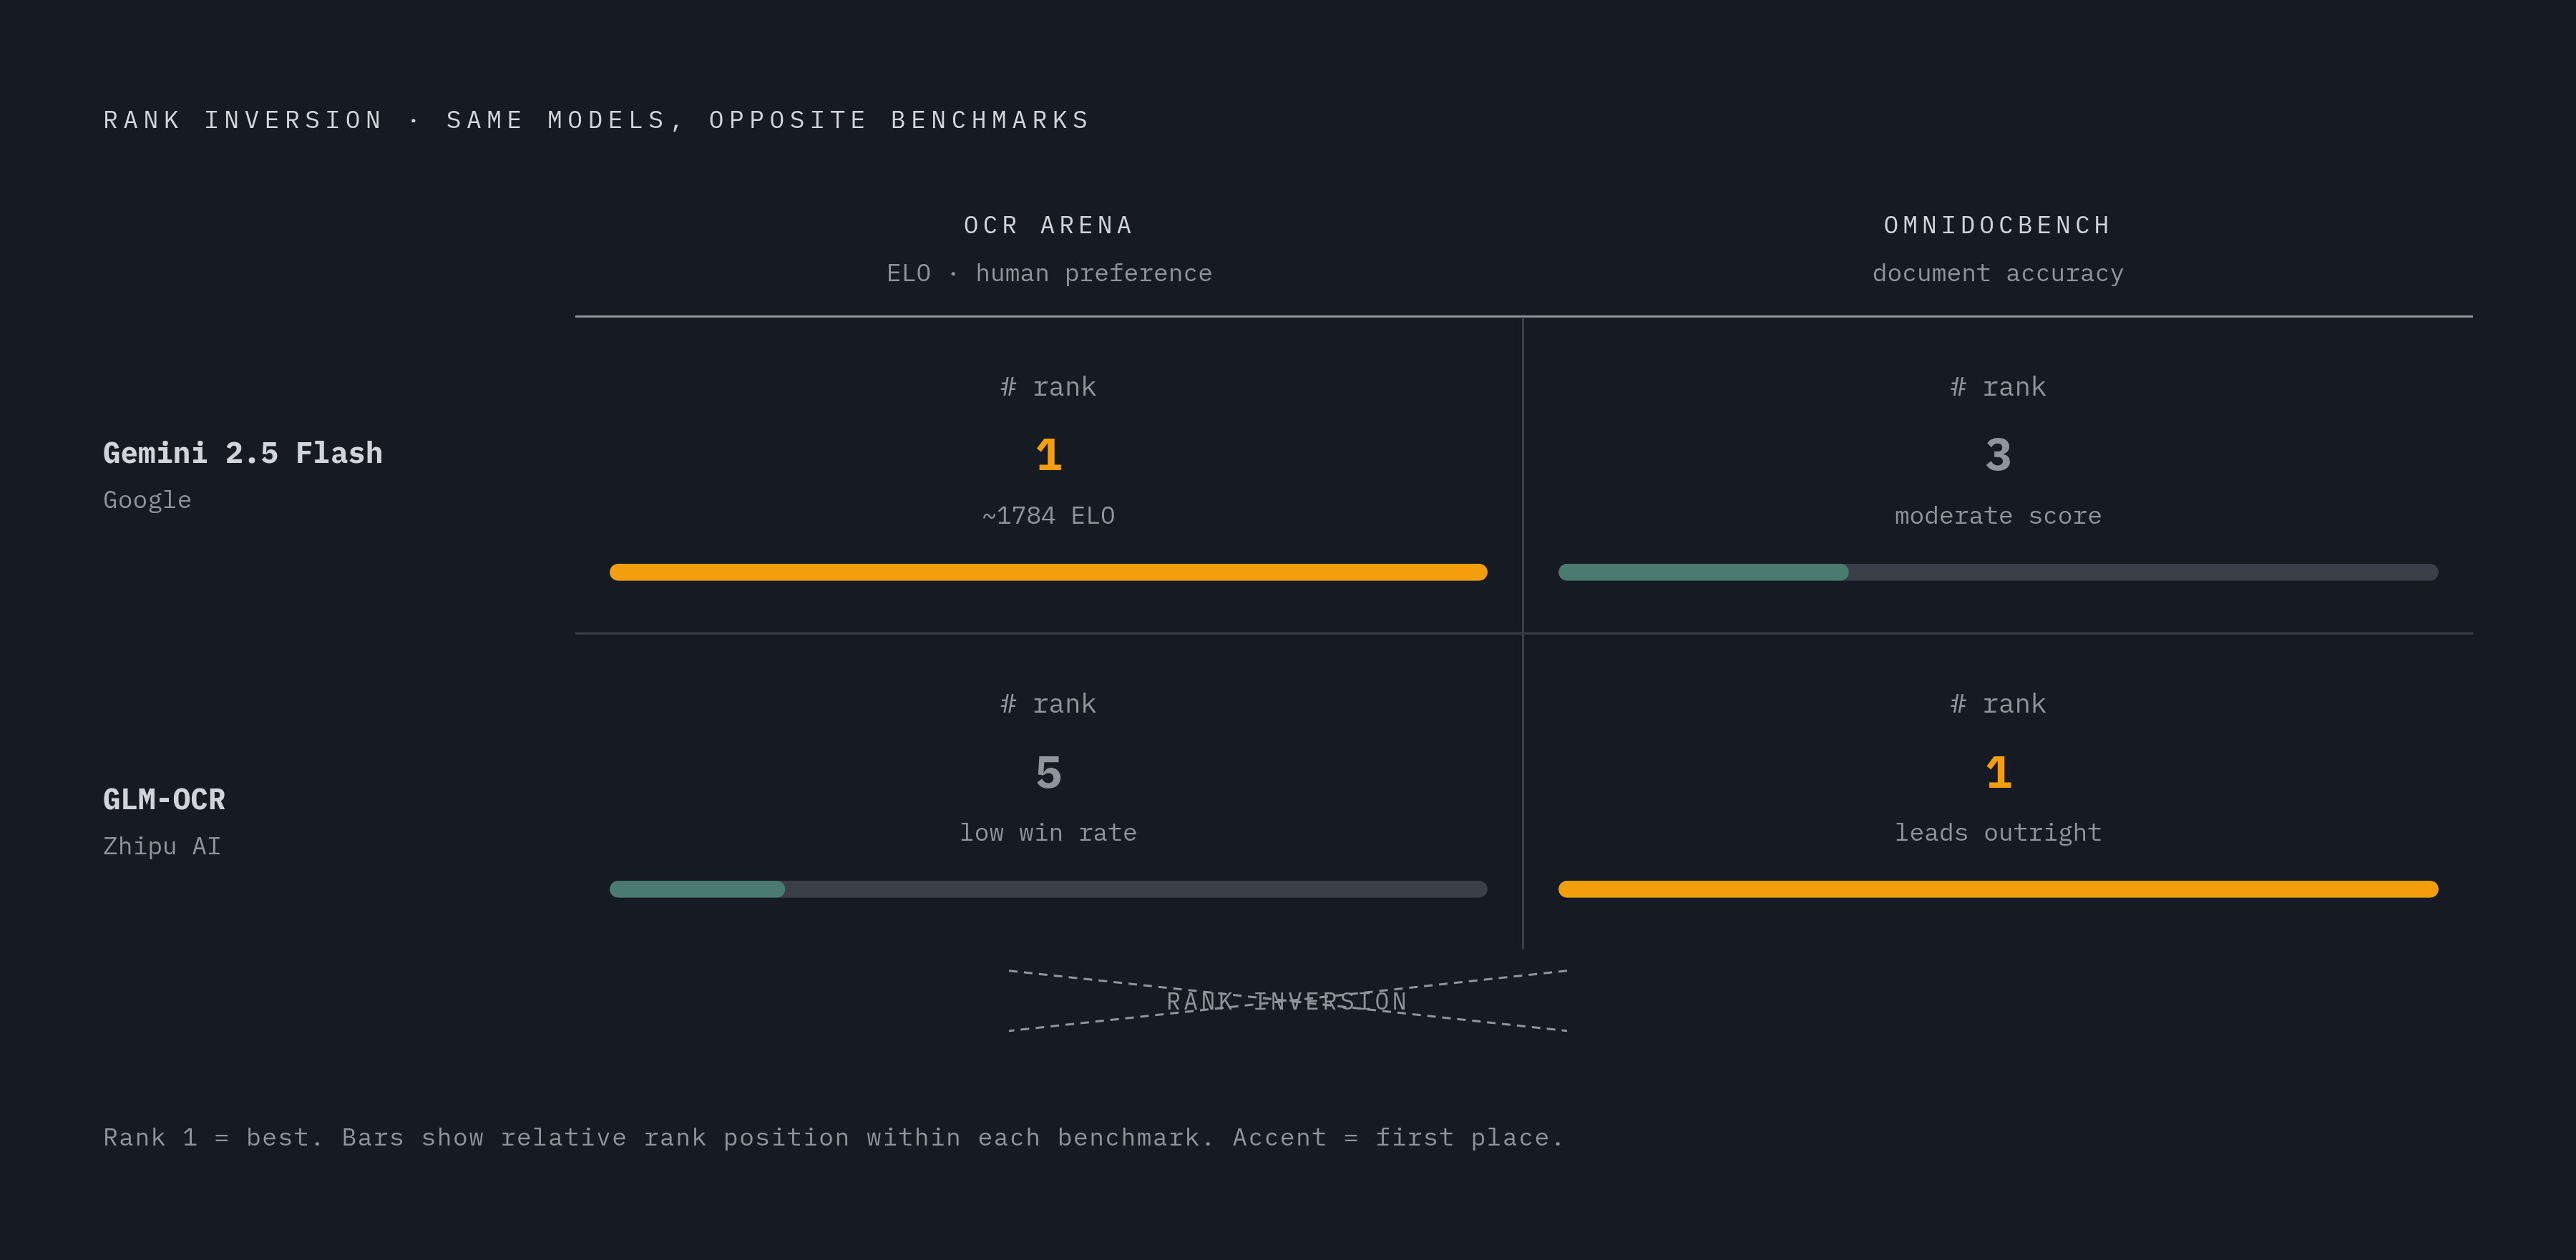
Different benchmarks don't just disagree at the margins; they can produce contradictory rankings for the exact same set of models. As of mid-2026, Gemini 3 Flash posts an OCR Arena ELO of roughly 1784 and a high win rate in head-to-head arena comparisons, despite only a moderate score on OmniDocBench. GLM-OCR runs the opposite pattern: it leads OmniDocBench outright, yet scores poorly when evaluated through head-to-head human preference tests on OCR Arena. The model ranked first on one leaderboard lands near the bottom on another, using the same underlying systems.
That divergence says something specific: automated benchmarks and human preference tests are measuring different things entirely. A model that tops OmniDocBench has proven something real about its performance on that benchmark's particular distribution of documents, academic papers, textbooks, slides, exam papers, research reports, magazines, books, newspapers, and handwritten notes among them. It has not proven anything about the distribution of documents a given team will actually process, because that distribution is rarely the one the benchmark was built around.
The newer generation of benchmarks is built explicitly to close this gap. CC-OCR V2 covers five core document-processing capabilities across 16 subtasks and thousands of samples, and every sample carries annotations for ten fine-grained document factors, lighting, screen display, imaging quality, capture method among them, which makes it possible to trace a given failure back to the specific acquisition condition that caused it. Running 17 representative models through CC-OCR V2 shows that models with near-identical overall accuracy scores can fail in completely different ways depending on which document factor is stressed, a distinction that any single aggregate score erases. OmniDocBench takes a related approach by splitting documents into sub-types, books, slides, financial reports, academic papers, newspapers, textbooks, exam papers, magazines, and handwritten notes, so that performance can be read at the level of a specific document category rather than smeared into one number. RealDoc-Bench goes further still, building its evaluation from real production documents across logistics, healthcare, financial services, and real estate workflows rather than curated samples.
None of this means one benchmark is right and another is wrong. It means no single leaderboard score, by itself, is sufficient grounds to select a model for a production workflow.
Field-level accuracy as the metric that predicts production behavior
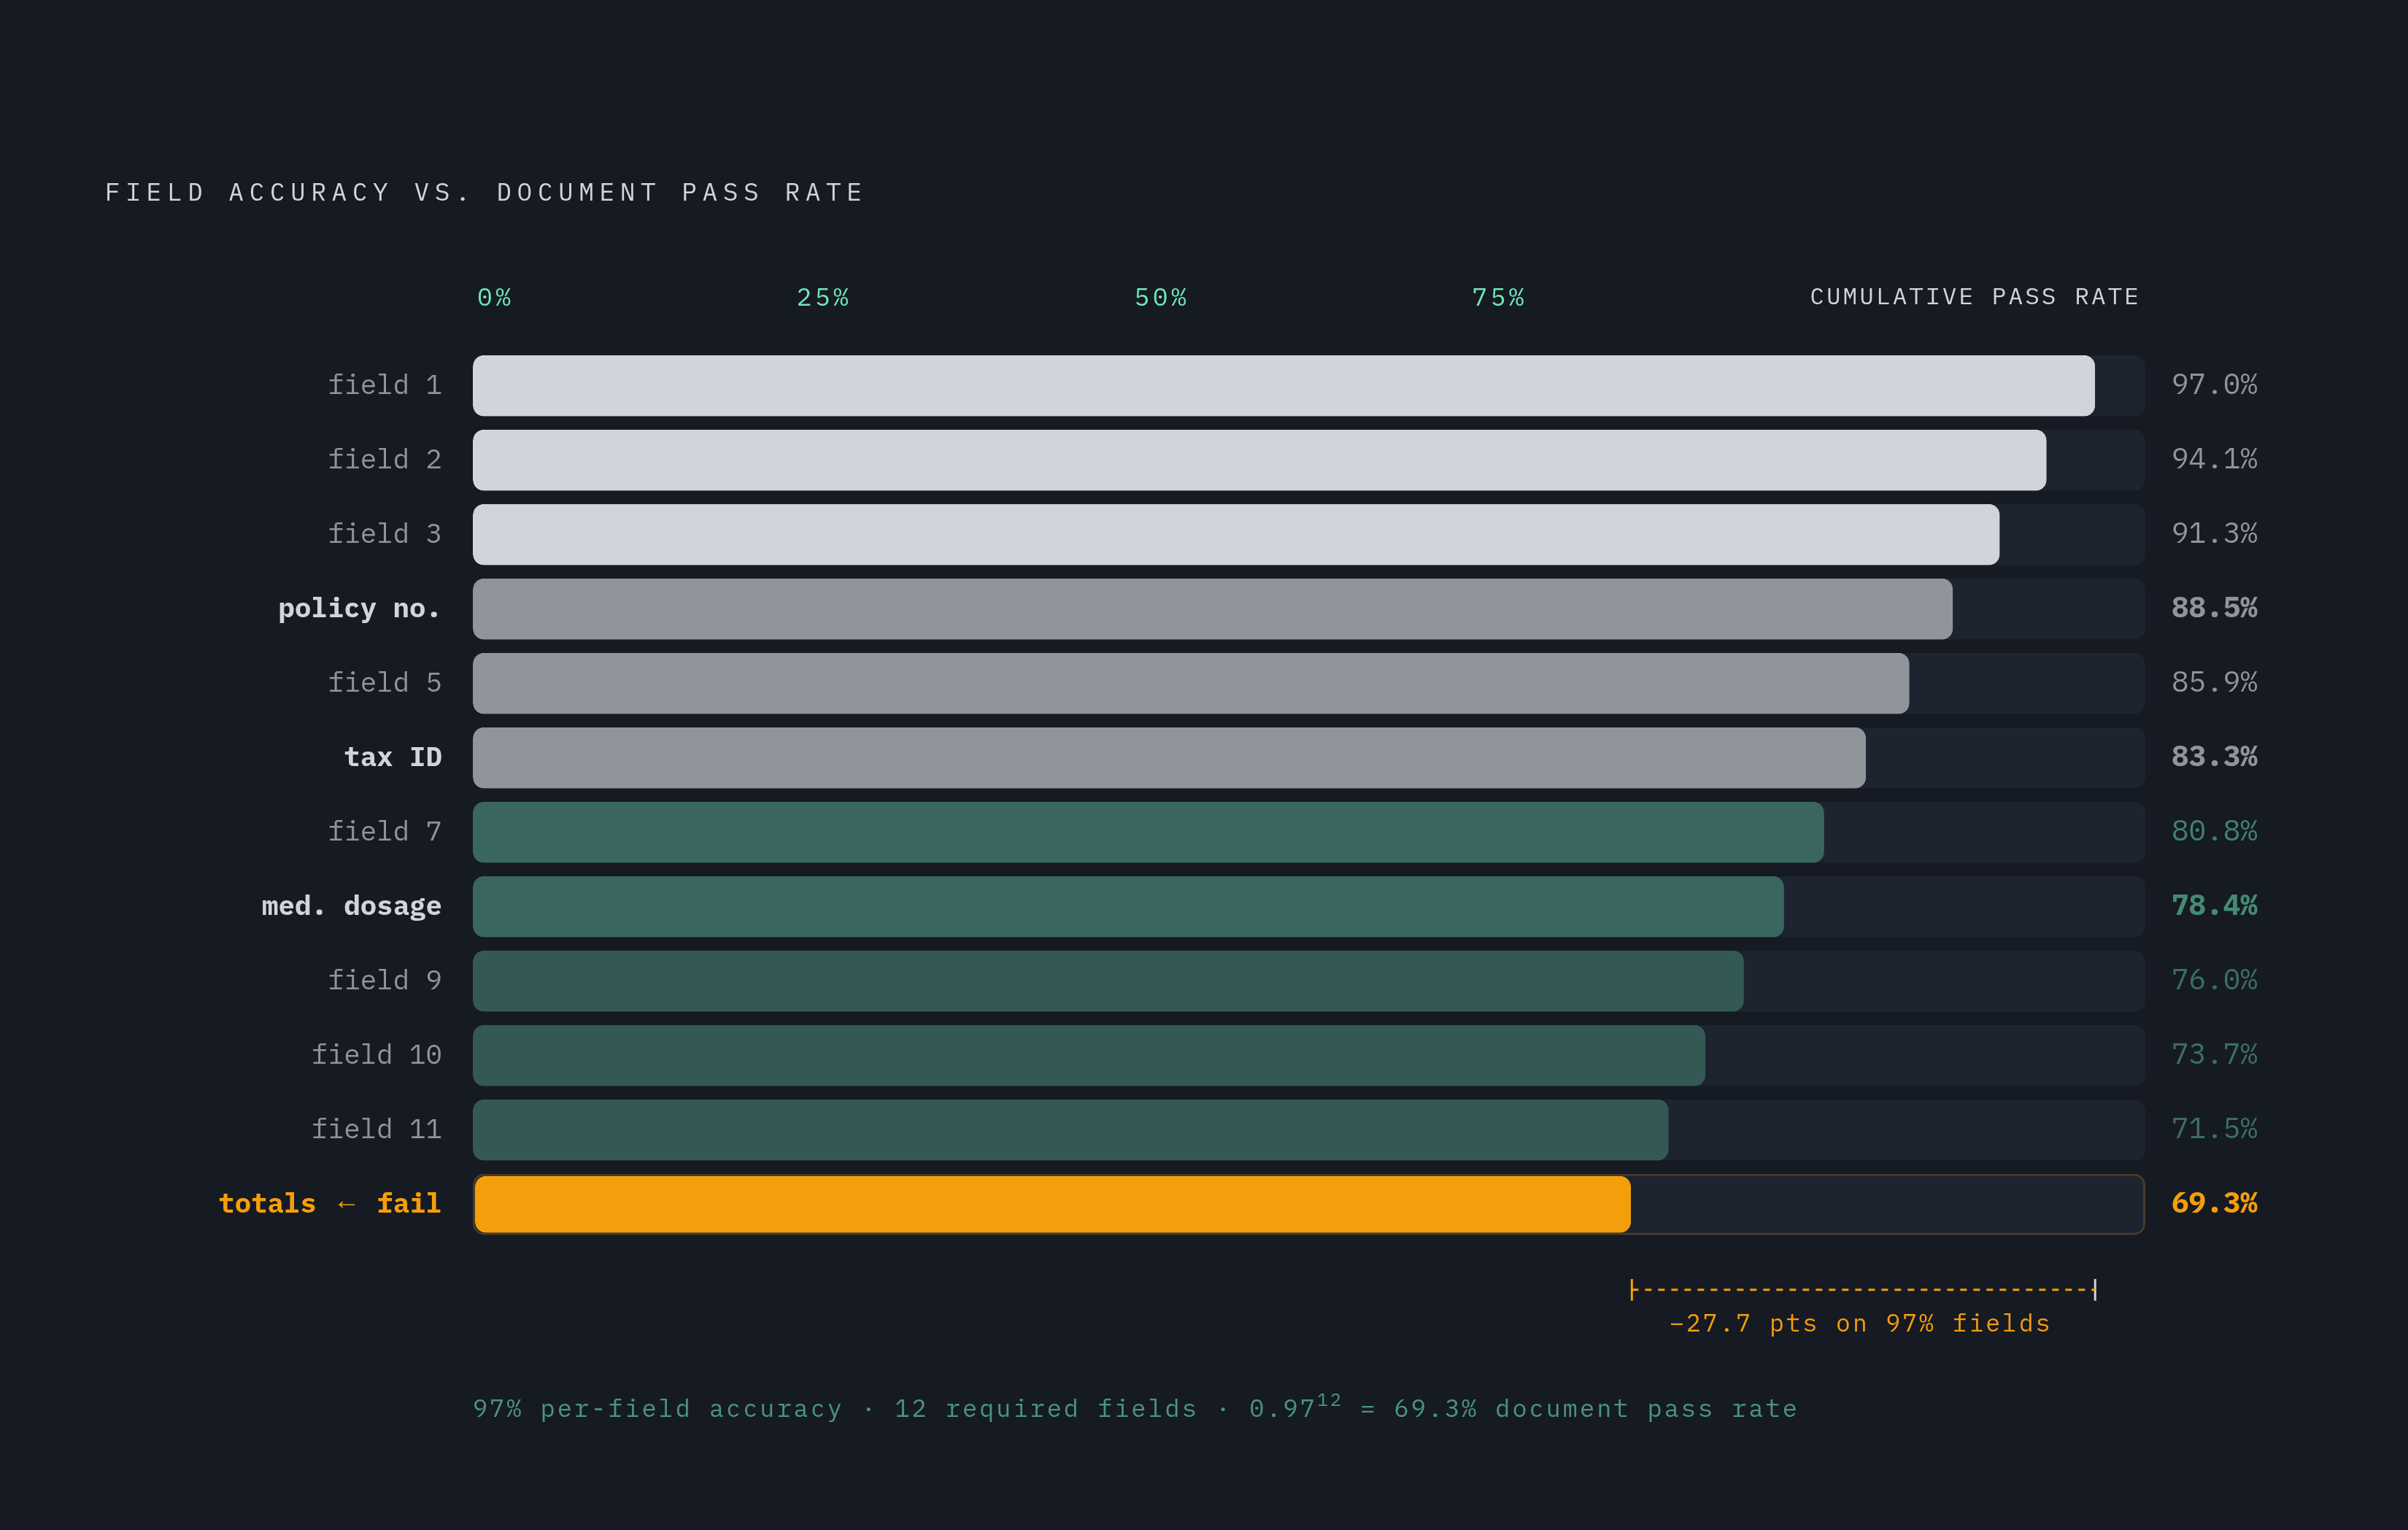
Document-level and blended accuracy scores systematically overstate how reliable a pipeline actually is. Per-field accuracy is the only metric that shows where a workflow will actually break, because it's the only one that measures at the level where failures actually cost money.
The math compounds in a way that document-level scores hide: a model that performs well on each individual field still sees its document-level pass rate collapse once a document requires getting a dozen or more fields right at once, since real vendor invoices arrive in dozens of formats from the same supplier across a 12-month period, unlike benchmark documents that use a single, stable layout. A strong document-level average can still miss the one field an entire workflow is built around.
Blended scores hide exactly the failures that matter most. An accounts payable pipeline that correctly extracts the vendor name, the address, and every line-item description, but misreads the total-due field, has failed that document completely, regardless of how strong its aggregate accuracy score looks on paper.
What predicts production behavior is accuracy tracked separately, field by field and field-type by field-type. High-stakes fields, totals, tax IDs, policy numbers, medication dosages, need to be scored apart from low-stakes fields like boilerplate text and standard addresses. Accuracy also needs to be tracked separately by document sub-type, because the same model can behave very differently on a clean, born-digital invoice than it does on a scanned mortgage closing disclosure with skew and handwritten annotations.
Layout detection and text extraction need to be reported as two separate numbers, not folded into one. Layout detection governs whether a system correctly identifies regions on the page, tables, headers, columns, and the order in which they should be read. A parser can transcribe every single character correctly and still assign those characters to the wrong row, column, or field region entirely, and a composite score cannot capture that kind of failure.
Constructing ground truth and normalizing extractions for reliable scoring
A field-level accuracy score is only as trustworthy as the normalization policy applied before anything gets compared. Without a deterministic set of rules for what counts as a match, the exact same extraction can be scored correct in one pass and incorrect in another, purely because of arbitrary formatting differences that have nothing to do with whether the extraction was actually right.
Building reliable ground truth means making a set of decisions before a single document gets scored, not after. Currency values need commas, currency symbols, and whitespace canonicalized into one consistent form before any comparison happens. Numeric fields need a fixed, consistently applied rule for decimal handling. Dates need to be cast into one canonical format, such as YYYY-MM-DD, before any matching takes place. Values that come back missing, unparsable, or that fail normalization altogether should be counted as errors and routed into exception review, never silently dropped from the dataset where they'd quietly inflate the score.
The test set itself needs to be built from actual production documents, edge cases included. Vendors who report high accuracy on clean, curated samples aren't lying, but that number says little about how the same system handles handwriting, poor scan quality, or genuinely complex layouts. The evaluation dataset needs to exist before a team commits to a vendor or a model, not after the contract is signed, and it needs to include the specific documents that broke previous systems alongside a representative cross-section of easy ones.
Confidence scoring brings its own set of traps. Averaging a confidence score evenly across an entire document is misleading, because a single tiny, blurry watermark can drag down the apparent confidence of an otherwise perfectly legible page. An area-weighted average, one that multiplies each text block's confidence by the size of its bounding box, prevents that kind of distortion. Confidence also has to be calibrated and traceable back to actual pixels on the page rather than inferred after the fact. A high confidence score from a vision model means nothing if the underlying value was hallucinated rather than read, and aggregate benchmarks never capture that specific failure mode.
A rigorous benchmark suite for each major production document type
Benchmark design has to change by document type, because layout complexity, which fields carry the most risk, and the kind of noise each vertical produces differ enough that no single test protocol can surface the right failure modes across all of them.
Invoices and accounts payable documents carry their highest stakes in the vendor tax ID, the total due, line-item unit prices, and payment terms. The failure modes to watch for are multi-column line-item tables, merged cells, rotated headers, and the fact that a single supplier's formatting can shift repeatedly across a 12-month period. A benchmark built for this vertical needs dozens of format variants pulled from the same vendor relationship, not one clean representative sample standing in for the whole category.
Mortgage and lending packages put the highest stakes on tax form values, bank statement balances, loan amounts, and dates. The failure modes here include mixed handwriting and print, physical stamps, DPI that varies from page to page, and the challenge of resolving the same entity across a package that can run past 200 pages. Scoring these packages page by page structurally cannot evaluate whether a system resolved a reference correctly across that many pages, so the benchmark has to score at the level of the whole document or package.
Insurance claims and healthcare records each bring their own version of the same problem. Insurance claims intake mixes policy numbers, loss details, medical codes, and estimates pulled from packets that combine multiple document types at once. Healthcare records push the layout variability even further, with handwritten consult notes buried inside charts running 800 pages, alongside checkboxes, prior authorizations, and lab reports, and errors in protected health information carry real regulatory consequences on top of the operational ones. Both verticals require the benchmark to separate PHI field accuracy from boilerplate field accuracy.
Logistics manifests introduce a different set of failure modes: nested tables that span across page breaks, rotated text, and documents that mix multiple languages within the same file. RealDoc-Bench treats logistics as one of four real-world workflow domains it evaluates, alongside healthcare, financial services, and real estate.
Scientific and technical documents sit apart from the rest of this list. TEXOCR-Bench shows that reconstructing compilable, structure-consistent LaTeX from a scientific document demands capabilities well beyond accurate transcription, and models that perform strongly on PDF-to-Markdown benchmarks degrade sharply once structural invariants, section structure, float placement, label-reference integrity, are actually evaluated. The lesson carries over directly to production: the required output format has to be part of the benchmark design from the start, not something bolted on after the transcription quality has already been judged.
Token cost and latency versus accuracy in high-volume pipeline benchmarking
Accuracy by itself is not enough to choose a model for production: latency and per-page cost are measurable dimensions in their own right, and a high-scoring model can still be unusable inside the pipeline it's meant to run in.
The tradeoff between accuracy and cost is real and it's measurable in dollar terms. In structured field-extraction evaluations, the single highest-accuracy option can cost several times more per document than a model that scores only marginally lower on accuracy, and that cost gap turns into a decisive factor once monthly page volume climbs high enough. Top-scoring LLM-based OCR systems carry token costs and latency overhead substantial enough to make them unworkable once volume passes roughly 50,000 pages a month, and the benchmark numbers that produced their accuracy scores exclude that deployment reality entirely.
A model that ranks second or third on raw accuracy can still be the right choice for a given pipeline once cost per page and processing latency are weighed against the accuracy gap separating it from the top performer. None of the methodology covered here, field-level accuracy, normalized ground truth, document-type-specific benchmarks, replaces that economic judgment. It makes the judgment possible to make with real numbers instead of a single leaderboard score standing in for all of them.